
The Two Architectures, Part 4: The Geography of Value


August 4th, 2026
Part one argued that media services is splitting into two businesses with different architectures. One is pooled, platform-driven decisioning for the median advertiser. The other is per-advertiser decisioning for the enterprise. Part two measured the gap on one dimension. Across roughly 1.4 billion impressions, the open web priced page quality as statistical noise. One enterprise advertiser scored inventory against its own value function and captured a 67% lower CPM and a 20% lower cost per outcome. Part three argued the split is now reaching measurement, where the enterprise stops deciding on the seller’s attributed number and starts measuring effectiveness for itself.
This piece takes the part two finding and removes its most interesting variable. Page quality was a subtle signal. It took independent scoring across over a dozen features to see it. So set it aside. Take the bluntest dimension in advertising, the one a child could reason about: Where was the human my ad reached? Score nothing but location. The mispricing is still there. It is as large as the page-quality gap and just as structural. The pooled stack optimizes a national number. A national advertiser’s value is local and uneven.
This discovery was surprising. The platforms are failing at an easy problem. They misprice location because their objective has no term for even the most basic thing a national advertiser knows about its business. It knows where it is weak.
A second thread runs through the three case studies below. Each was judged by an independent measurement source, not by the platform that ran the media. Hershey measured against held-out control markets. A global consumer electronics brand measured through a controlled survey deployed by Cint. Shutterfly measured search lift through EDO. Part three claimed the enterprise is moving to measurement it controls. These case studies are proof points for that argument.
Here are three enterprises with no overlap in category, agency, or KPI. Each scored its buying on a different grain of location. A store. A market. A state, crossed with the message. In every case the same thing happened. The money went to where the business believed it was losing, because that is where ad dollars can do work. The pooled objective would have sent it to where the business had already won.
The dimension the stack flattens
Start with what the pooled stack does with geography. You can tell it where you are allowed to buy. You cannot tell it that a sale in Tulsa is worth more this week than a sale in Los Angeles. Nothing in your choice of KPI goals corresponds to that. The objective is a national outcome, pooled across the advertiser base and optimized to an aggregate. Geography enters as a boundary on the map. It does not enter as a conversion value.
So the stack spends where the outcome is already concentrated. That is the populous, high-volume places, where CPMs are low because supply is abundant. A model minimizing cost per outcome will always prefer them. It is doing exactly what it was built to do.
Now look at the same map through the eyes of a company that sells real things in real places. Its value is not concentrated where volume is. It is probably where volume isn’t. A store that has not sold through its seasonal inventory. A market where the brand is weak and the category is strong. A state where, for reasons no one fully understands, the message has not landed. The job of the budget is to close those gaps. The pooled objective does the reverse. It pours money into the places where the gap is already closed, and reports cheap conversions there as success.
This is why the platforms make no real effort to extract the most awareness, or the most sell-through, or the most new customers, from a fixed budget across a geography. It is not that they are careless. Maximizing a national advertiser’s outcome across its own uneven map is not the problem they are solving. They are solving for the aggregate. The aggregate has no lagging markets. It is an average, and an average cannot be behind.
The three campaigns below are what it looks like to solve the other problem.
Hershey, value at the level of a store
The Hershey Company sells a seasonal, perishable product through physical retail. Halloween is its superbowl, and it never goes into overtime. They sell-through 90% of seasonal bags in every store by Oct. 31 or lose money. Below 90%, the store cuts next year’s order. On November 1 the bags are marked down 50%. The goal is not a media KPI, and no media KPI has anything to do with the goal.
Sell-through is a property of a place. A store in one zip code clears its inventory fast. A store two states away lags. Sell-through velocity is a market’s propensity to respond, and it lives at the level of a store, not a person. The pooled stack cannot act on it, because nothing in its objective corresponds to a store. Hershey’s prior approach leaned on expensive national audience segments such as “Holiday Enthusiasts.” That limited scale and, by the company’s account, weakened its marketing-mix results. Audience targeting concentrated reach in the most populous places. That is not where the sell-through problem lived.
Hershey built the opposite. A Chalice allocation model sat above Trade Desk, YouTube, and Meta. It set a weekly budget for every set of zip codes served by a Target store, weighted to that store’s relative sell-through of Hershey’s Halloween inventory. Each week it took fresh store-sales data and automatically rebalanced. Lagging markets got more. Markets already on pace got less.
A model optimizing attributed sales spends where sales are already happening. Hershey’s value function did the reverse. It moved money toward the markets that were behind, because that is where advertising could have the greatest effect. The campaign held out control markets to measure lift. It produced 1.5 points of incremental sell-through. It carried the portfolio to its goal. It gave Target the highest sell-through of any Hershey retail partner.
Efficiency gains compounded the result. An 80% cut in data fees moved more budget into working media. Algorithmic optimization took more than $2.50 off the CPM over the campaign’s life.
This was not one season’s luck. Hershey has run the method across five consecutive seasonal pushes. Each was measured against a control.
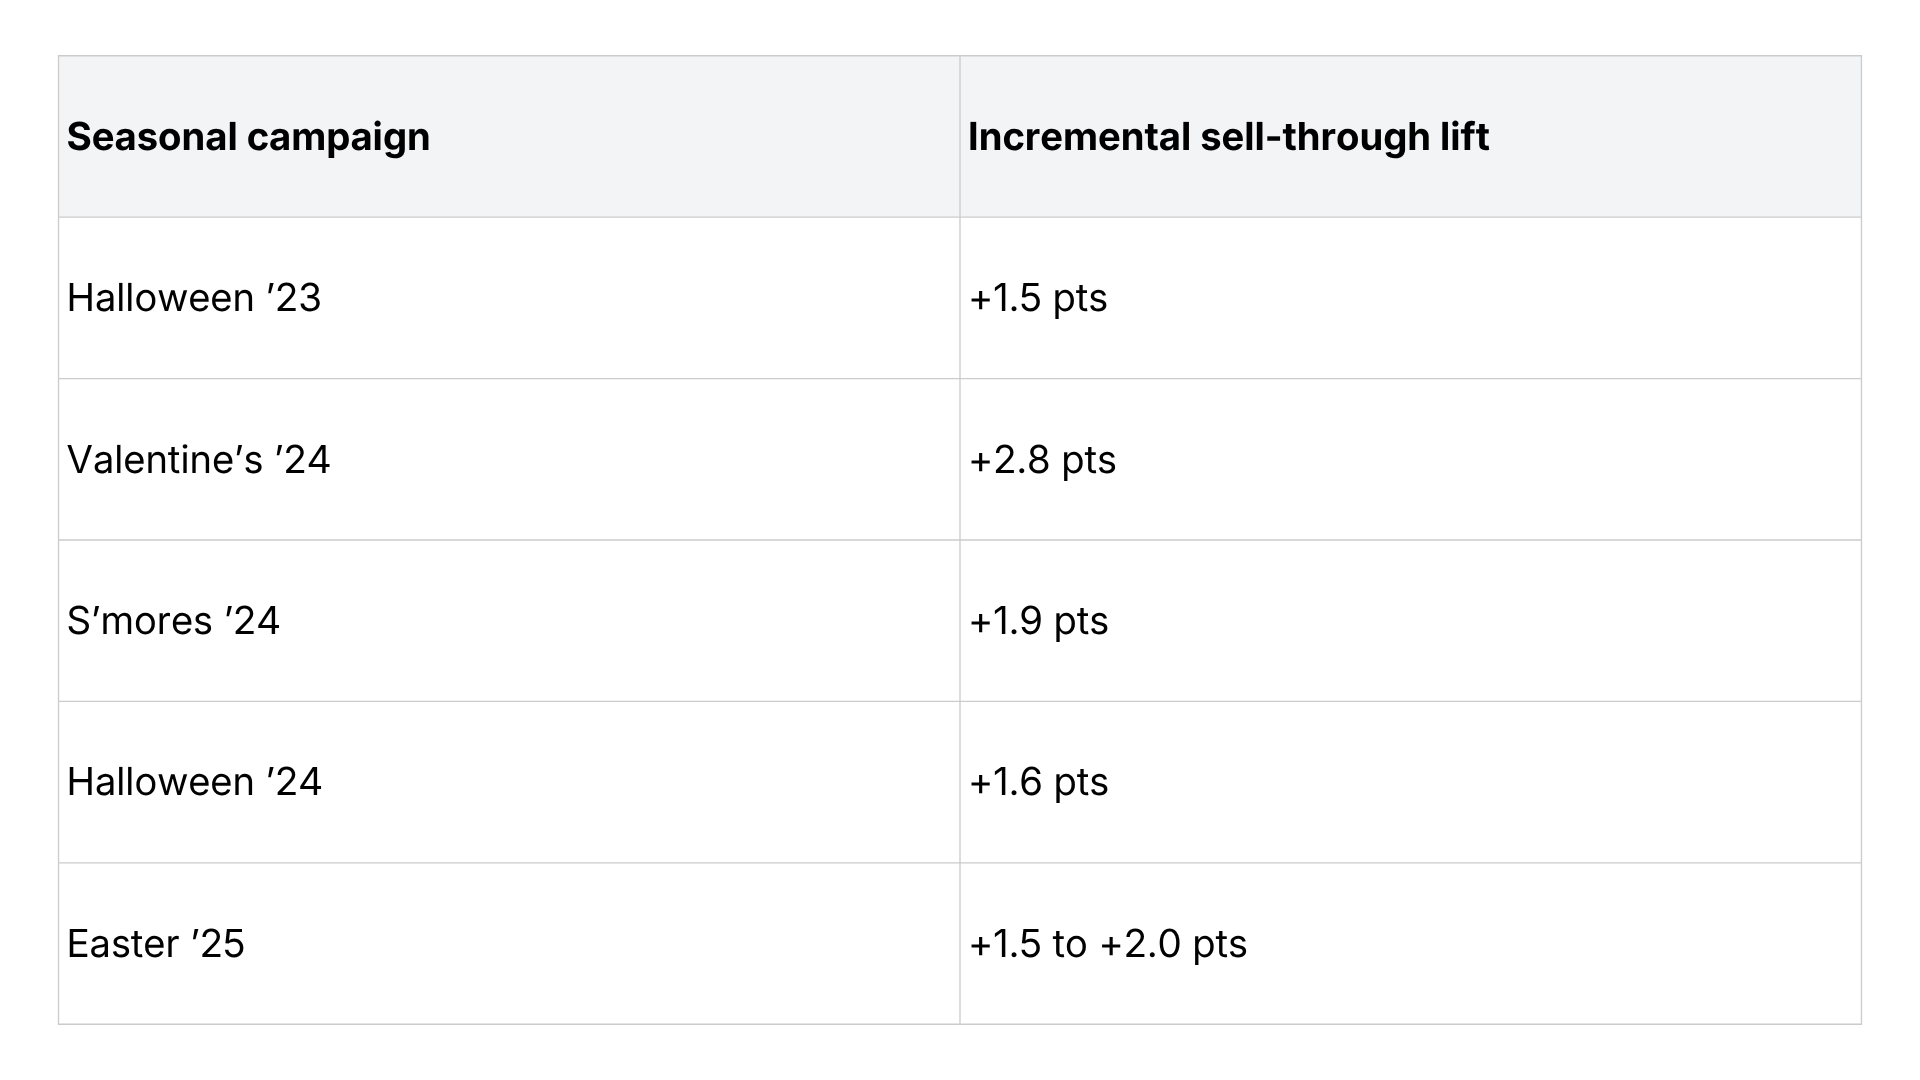
Platforms claim the ability to drive sell-through with location-sensitive algorithms. But a retail media network can’t know the total spend in Lincoln Nebraska across all retail media networks and Meta, and optimize the allocations. It cannot produce a per-brand, per-store value function anchored to one brand’s reorder deadline. It is not built to weight a single advertiser’s lagging-market problem above everyone else’s. At best, it improves the average. Hershey does not have average challenges.
Shutterfly, value at the level of a market
Hershey scored location at the grain of a store. Move up one level, to the media market, and same solution works.
Shutterfly wanted to grow its customer base in places it had not reached. The working idea was that regional search behavior reveals where the opportunity is. A market where few people are searching for the brand, but many are searching the category, is a market with untapped demand. The brand is weak there and the appetite is strong. That gap is the target.
A pooled stack cannot reason this way. Its addressable-audience strategy depends on device graphs and identity signals. In Connected TV especially, the probabilistic identity layer struggles to find scale. The stack reaches for the audiences it can resolve. That pushes it back toward the places and people it already knows.
Chalice built a different model. It trained on category, brand, and competitor search trends, with the data sourced through EDO. It placed CTV ads in the DMAs where brand search engagement was low and category demand was high. As engagement in a market improved, budget rotated to the next market that needed it. The allocation chased the lagging DMAs, the same way Hershey’s chased the lagging stores.
The result was a market-by-market turnaround. Search engagement rose by as much as 15 points in the DMAs that received more budget. Of the top twenty DMAs by improvement, 16 went from underperformers to engagement-growth leaders. The model did not lift the markets that were already strong. It found the ones that were behind and moved them.
It also beat every other tactic on Shutterfly’s media plan. Against lookalike targeting, against Dstillery, against Samba, against retargeting, and against The Trade Desk’s own optimization, the Chalice approach delivered the highest new-customer percentage, the highest new-customer ROAS, and the lowest cost per new customer. New-customer ROAS climbed from $0.31 in October to $1.49 by December. Cost per new customer fell from $243 to $57 over the same window. The competing lines moved too. None moved as far.
EDO measured the lift. Again, the grade did not come from the platform that ran the media.
A global consumer electronics brand, value at the level of a state
The last case is the one that should not work, by the pooled stack’s logic.
This brand ships more PCs than anyone. It is not first in awareness. Awareness does not follow market share. It’s typically purchased at great expense over a period of years. The brand had a seven-week window, two markets across the US and Canada, and five awareness KPIs to move. Every brand dollar had to pull its weight.
Most brand campaigns build a plan, launch it, and read the results at the end. The Chalice model read them in flight. It scored combinations of creative and location, state by state. The grade was awareness lift. A survey measured it week by week. The model then moved budget toward the creative-and-place combinations that were lifting awareness most efficiently. It did this while the campaign was still running.
We cannot explain why a particular message moved awareness harder in one state than another. Models do not tell stories. The reasons are probably some mix of regional familiarity, competitive presence, and cultural fit that no national segment captures. The point is the pooled stack never looks for these combinations at all. It treats creative as one lever and geography as another, each tuned to a national average. Their interaction on the results of a controlled study is exactly the kind of private, advertiser-specific structure that a pooled stack cannot accommodate.
The model surfaced a finding that contradicts best practices for awareness lift. Conventional wisdom holds that five to seven impressions is the optimal dose. The brand’s best creative/state combinations drove 8.9% lift with a single impression. When the right message meets the right place, frequency stops being the lever. The frequency heuristic is a national-average artifact. The enterprise architecture can find where it is wrong.
The brand’s campaign lifted all five KPIs. Brand awareness rose 8%, five times the benchmark for the category. Ad recall rose 4.4%. Brand consideration rose 4.7%. Brand attributes rose 20.7%. Depth of awareness rose 17.3%.
Cint deployed the survey that produced those numbers. A third party measured the lift, against a control, on the metric the brand cared about. The platform was not asked to grade itself.
There is a plain lesson in this result that the industry has not absorbed. A platform running a brand budget does not try to produce the most awareness that budget can buy. It can’t. It spends the budget, reports reach and frequency against a national plan, and calls that the job. Producing maximum awareness from a fixed budget is a different job. It is very doable. The pooled stack is the wrong tool for it.
What this means for enterprise location strategy in 2026
Put the three campaigns side by side and the pattern is not subtle.
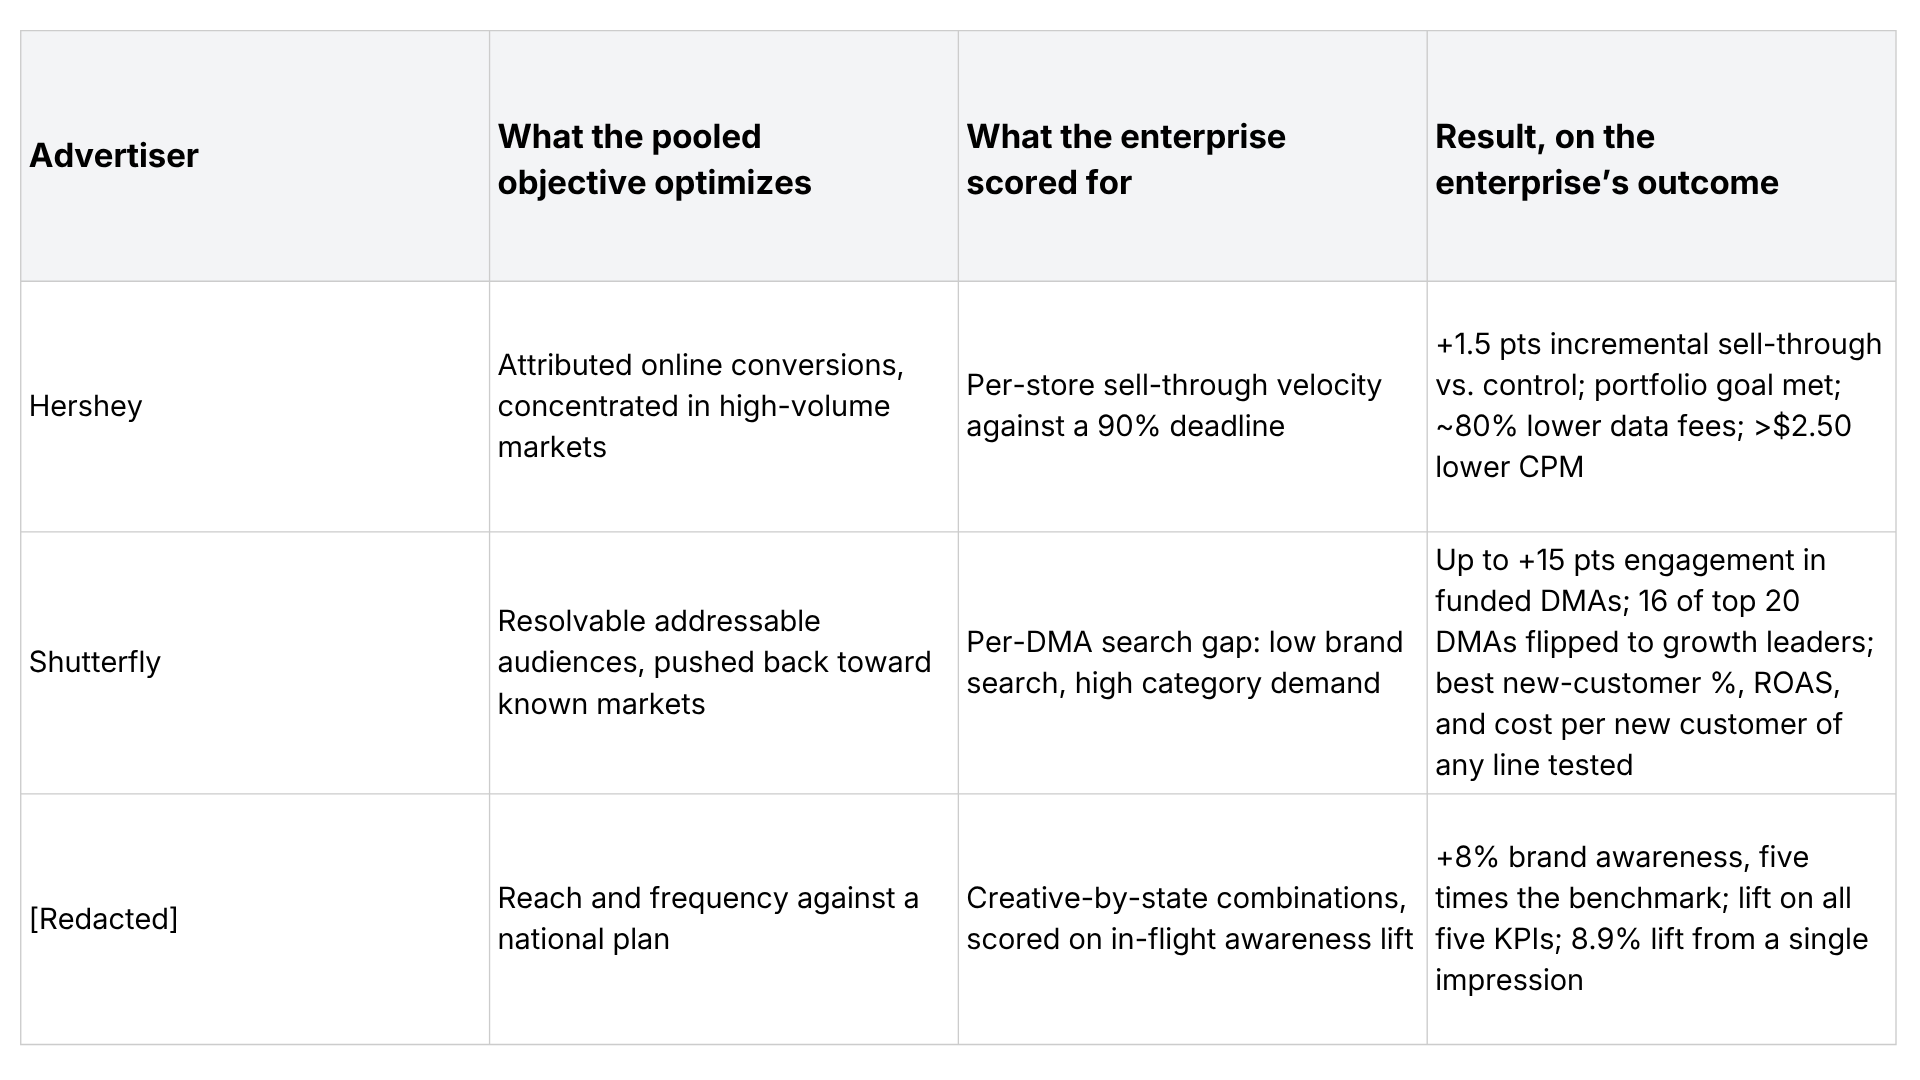
Three enterprises, three grains of location, one shape. A pooled objective would have spent on Hershey’s leading stores, skipped Shutterfly’s soft markets, and run the electronic brand’s budget against a national frequency cap. Each enterprise did the opposite. Each was right by the only measure that mattered to it. Incremental sell-through. New customers in untapped markets. Awareness earned per dollar.
These campaigns scored only scored location, the crudest dimension on the board. The same opportunity uncovered by page quality scoring emerged. Still large. Still unclaimed by the pooled stack. The opportunity is not a property of page quality. It is a property of any dimension where the advertiser’s value diverges from the national aggregate. The rule under both features is one rule. A pooled market prices what its bidders hold in common and misprices what a single advertiser knows alone.
The next article in this series takes that rule to the dimension the whole industry fights hardest over, the identity of the customer, and finds the same gap waiting.
Systematic mispricing is invisible as long as the buyer accepts the platform’s optimization to attributed conversions. Independent measurement makes it visible. Once you measure against your own outcome, the pooled stack’s architectural bias toward already-winning places stops looking like optimization.
The infrastructure to score location this way exists and is running on live campaigns today. Standing it up took years and millions. Every quarter, its existence makes it harder for an enterprise to keep spending its budget the way a platform would. The decision in front of the enterprise in 2026 is not whether the pooled stack is good at finding the cheap conversion. It plainly is. The decision is whether the most valuable place to reach a customer is the place the national aggregate favors, or the place the enterprise’s own map says is behind.