
Platforms Pick 7.


October 27th, 2026
The difference
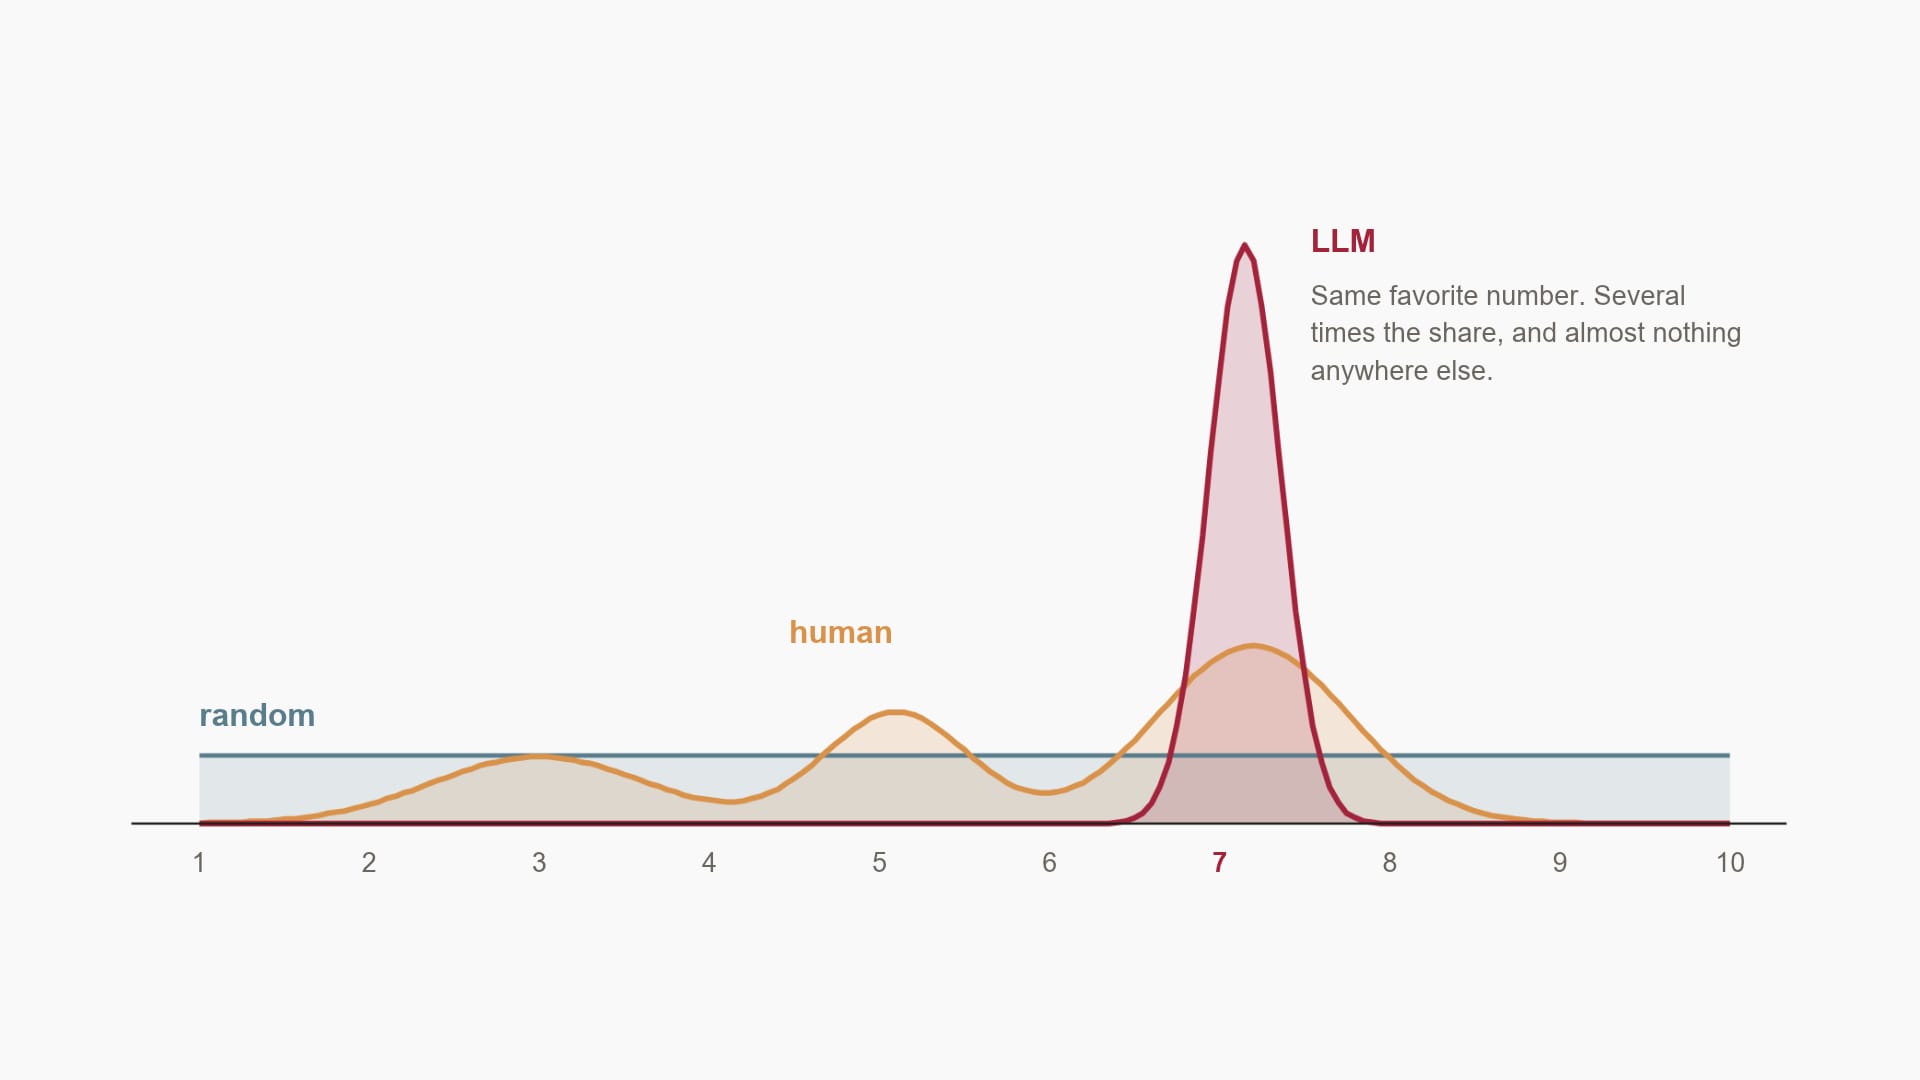
If you ask a few thousand people to pick a number between 1 and 10, and chart their responses, you get a lumpy curve. People avoid the ends and the middle. They avoid even numbers. The most common answer is 7, with 5 coming in second and 3 in third.
If you ask the same question in a thousand chatbot sessions, you get the red line below. It’s pretty much 7 every time.
If you’re a big brand trying to grow sales by spending in ad platforms, that red spike is your problem. The rest of this article explains why.
The explanation involves math, but you don’t need to do any calculation to understand it. You only need to learn the enormous difference between what you and your platforms get paid to do.
Great reader, average student
A chatbot can be trained to pick a number 1000 times and reproduce the yellow line almost exactly. If there were a market for a representation of human diversity, such a chatbot might exist. In reality, the big AI market is for bots that are usually right.
The model behind the chatbot read everything people ever wrote and learned that 7 is the most common answer to the question.
The model is tuned to give answers people approve of. That answer is usually the most typical one. So the machine works to arrive at the single most likely output. This process, where a set of possibilities are reduced to the most common, is what machine learning engineers call “mode collapse.” The name is a little misleading. What collapses is the distribution of responses across the human population. The mode, i.e. the most common answer, is what the distribution collapses into. The “tails” of the distribution get shaved off. Everyone who picked 3 or 5 or 9 was in the tails.
There is no 7
What if we tell the chatbot it cannot pick 7? The spike does not flatten. It moves to the runner-up and stays nearly as tall.
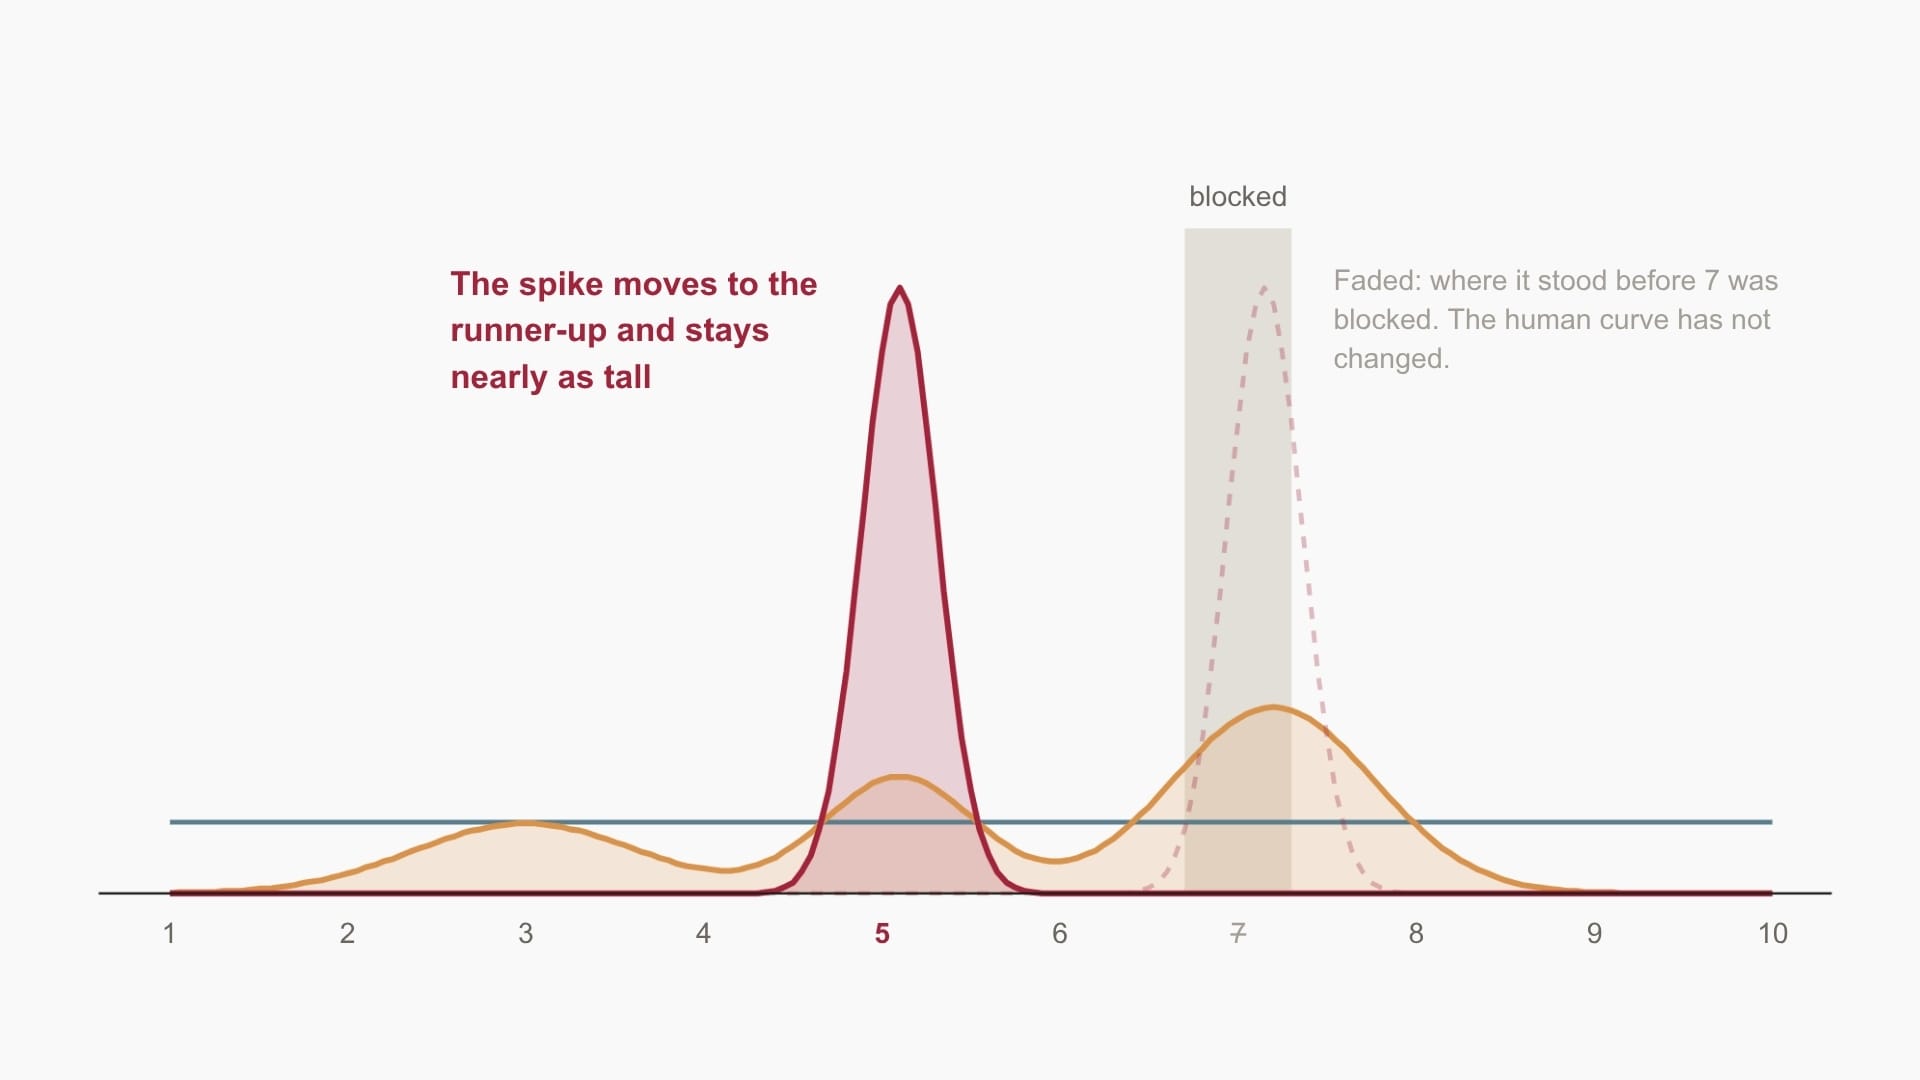
Nothing about how the model works changes. We took one answer off the table and it went to the next most common. Make a mental note of that. We’ll come back to it when discussing an advertiser suppressing its CRM list in an ad platform.
A prediction is a function with weights you
solve for
Most of us never ask Claude or ChatGPT to pick a number. And most of us don’t quite know how they work. So the spike at 7 reveals something – mode collapse – that’s happening somewhat secretly every time we use AI. No matter how human-like the responses seem, no person gives the average answer to every question. People diverge. A group of human answers will take the form of a distribution, with a tail of unusual responses. The bot represents neither a person nor a population. It represents its own purpose, which is to seem right in the eyes of the greatest share of users. The chatbot is a type of platform: one model, tuned to be right for the most people, served to everyone.
Ad platforms, too, are machines that make decisions to represent neither a person nor a population. The problem they solve, akin to chatbots, is to be least wrong across the largest number of advertisers at once.
To achieve that, ad platforms solve an equation. Given the facts about an impression opportunity, the platform outputs a number: the probability that impression leads to an attributed conversion. The equation has a weight for each fact. How much the site matters, how much the hour matters, how much it matters that this person has converted before. Tens of millions of weights. The whole question of machine learning is what those weights should be.
Here is a simple version. A rocket scientist wants to know the launch angle that burns the least fuel. She does not have a formula for it. What she has is five past launches, and for each one she knows the angle flown and the fuel it used.
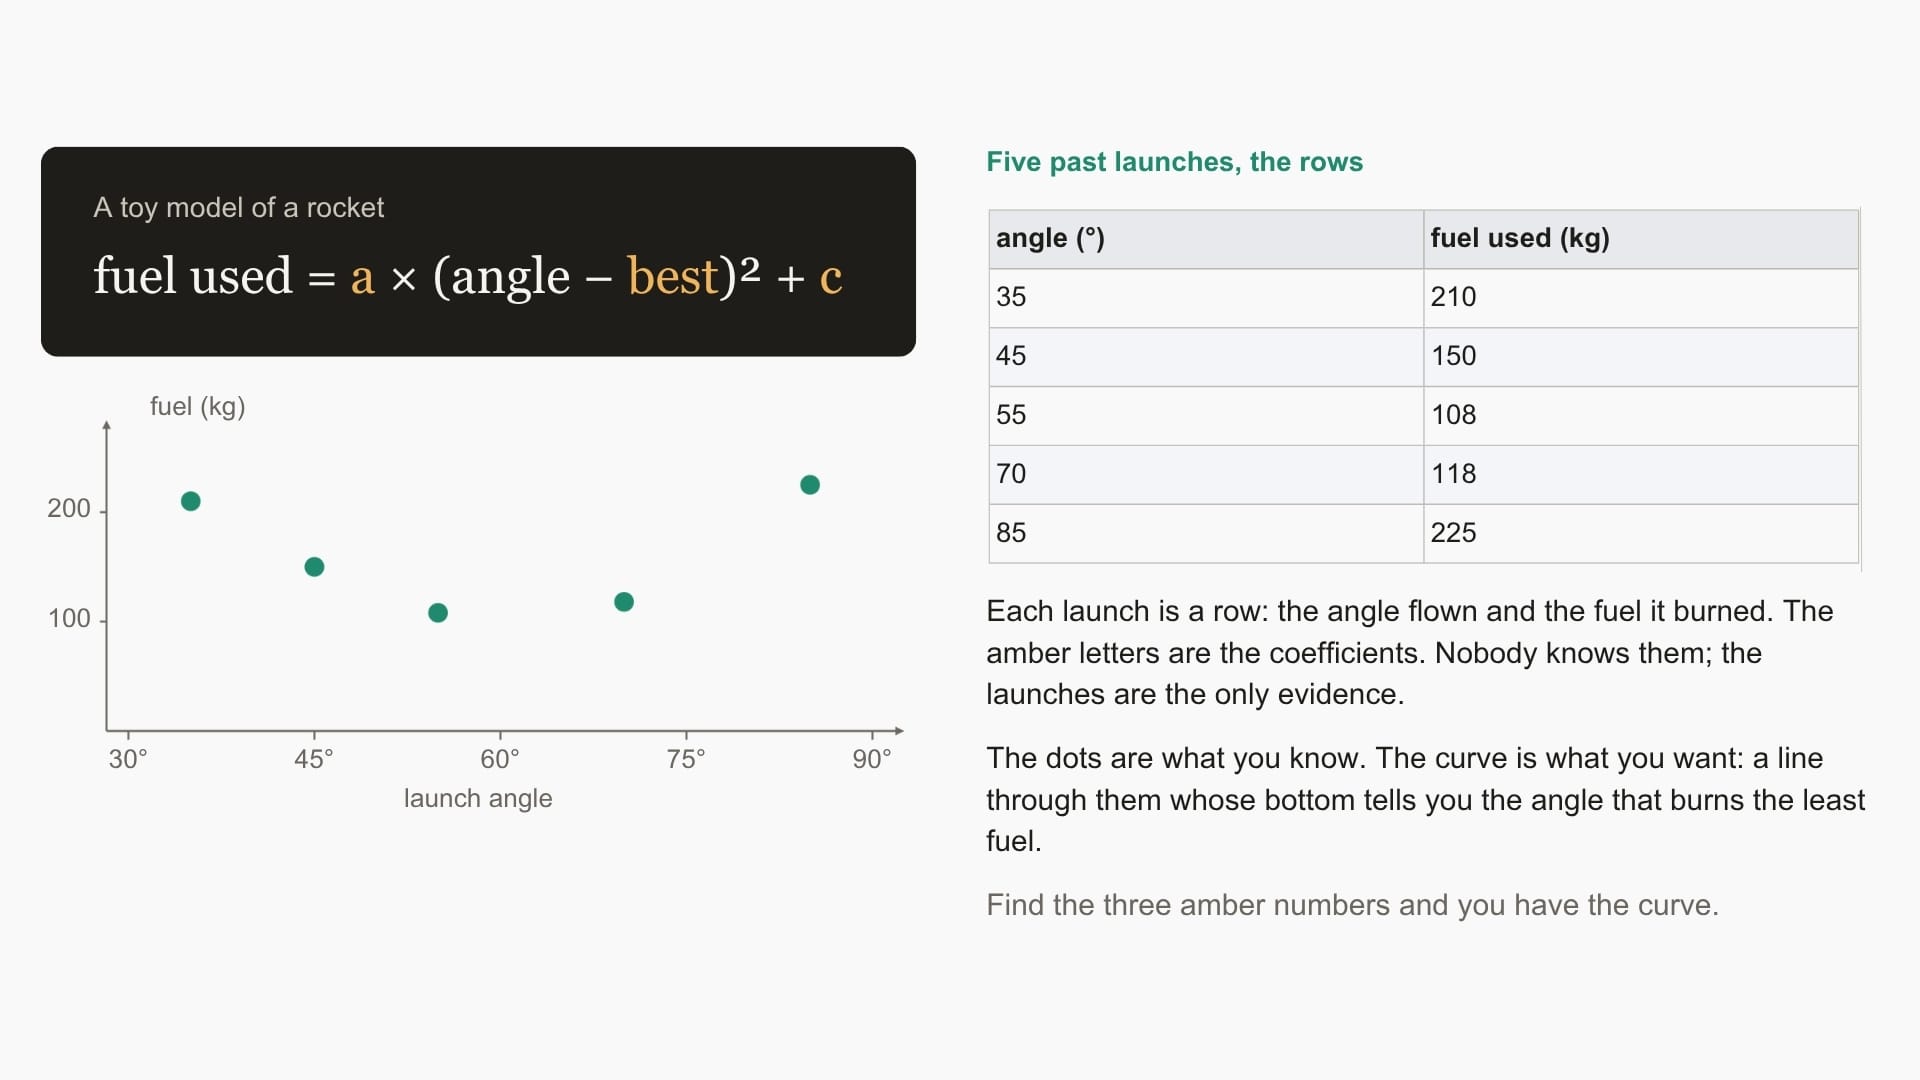
The rocket scientist has the shape of the answer and three unknowns: how much extra fuel is burned for every degree off the best angle, how much the best angle itself burns, and what the best angle is. Being good at math, she constructs an equation with three variables. She uses the equation for a bowl-shaped curve because she knows fuel used is greater on both the left and right sides of the chart: angle too high and angle too low. The previous launches are historical data. The equation is her claim about how the world works. Her job is to use both of them to fill in the unknowns.
The rocket scientist starts with any values in the blanks and draws the curve the filled-in equation defines. She measures how far it misses the five dots. That miss is the error. Next, she changes each unknown a little in whichever direction makes the error smaller, and keeps doing that until no change makes it smaller. Calculus tells her which direction to tune the variable values after every pass. It’s not about trying every combination. It’s more like finding the bottom of a valley on a moonless night. When you can’t go downhill any more, you’re there. When the error stops descending, the curve will fit the launches as well as its shape allows, and the best angle is revealed. This method is called gradient descent.
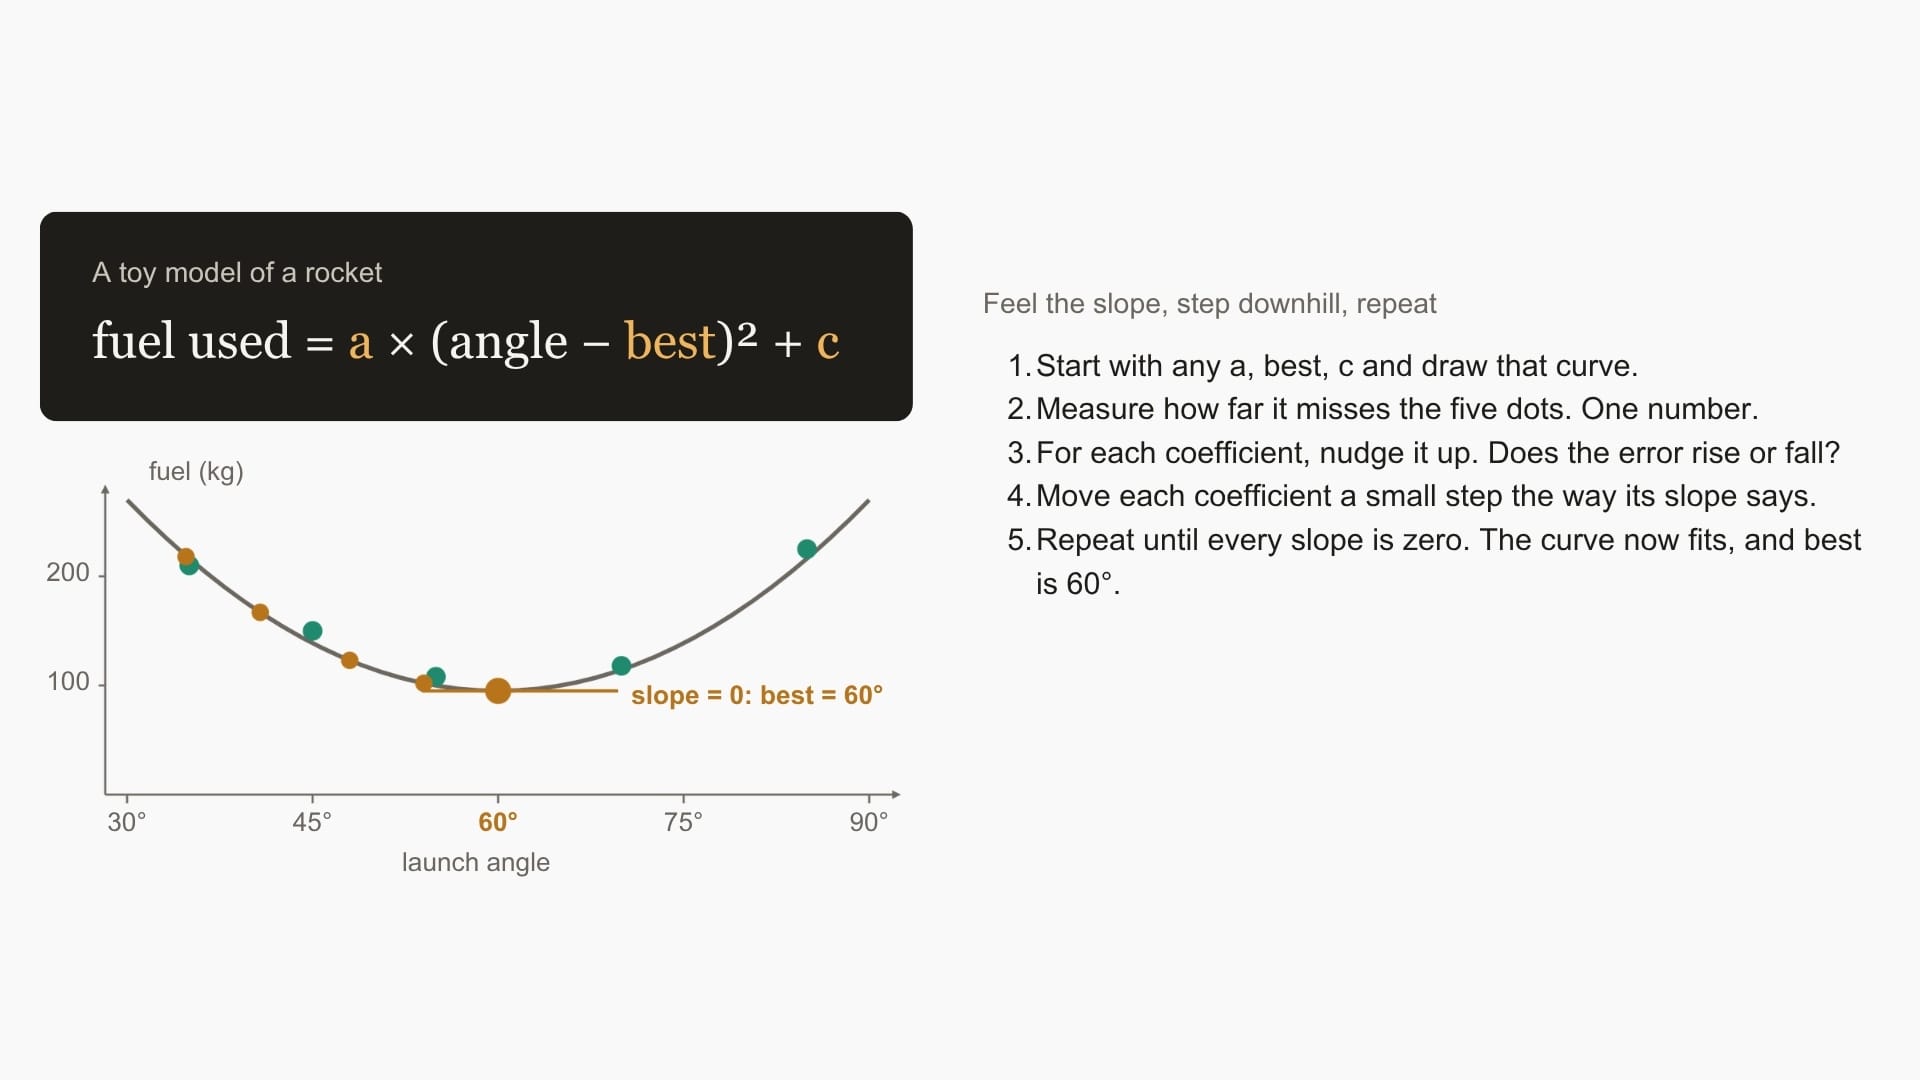
Notice what she ended up with. Not a law of physics. An equation that describes her five launches, with its unknowns set to whatever values made it miss them least. When she uses it to predict a sixth launch, she is extrapolating from what she knows. That is all any model does. It adjusts unknowns, also called weights, to reduce error until an equation describes the past, then applies that equation to the next case. What the model represents is the data it was fit to. Remember that.
One valley for all advertisers
Swap the rocket for a bid request. The things being weighted are the facts in the request: the site, the hour, the device, the zip code, the audience segments the user sits in, how many times they have seen the ad, and whether they have converted before, for any advertiser in the platform. Each fact has a weight. Build an equation, solve for the weights, and out comes a probability.
The probability is of one thing: that if the platform wins this auction, the platform will get credit for a conversion. Not a sale, but a conversion as the platform counts it, using the platform's rules. A prediction of 2% means that out of 100 requests that look like this one, the platform expects to end up with credit for two. If the historical data shows it actually ends up with credit for three, the model is 50% off – a big error. The error for the whole model is added up over every impression the platform has ever served, and solved by adjusting the weights.
The landscape for this search has tens of millions of dimensions, so nobody can draw it. Instead, we’ll draw the search for two weights on two dimensions, represented as a grid on a valley floor, like the board in the kids’ game Battleship. Every point on the floor is one guess for those two weights. Height is the error that guess produces across every impression opportunity. Gradient descent guides us downhill. Seen from above, the bowl is a set of rings, like a topographic map. Each ring is one magnitude of error. The outer rings are big misses, the inner rings are small ones, and the dot in the middle is the lowest the error can go. The goal is to get as close to zero as the equation allows. Where the error stops falling, we’ve hit the floor and arrived at the best weights.
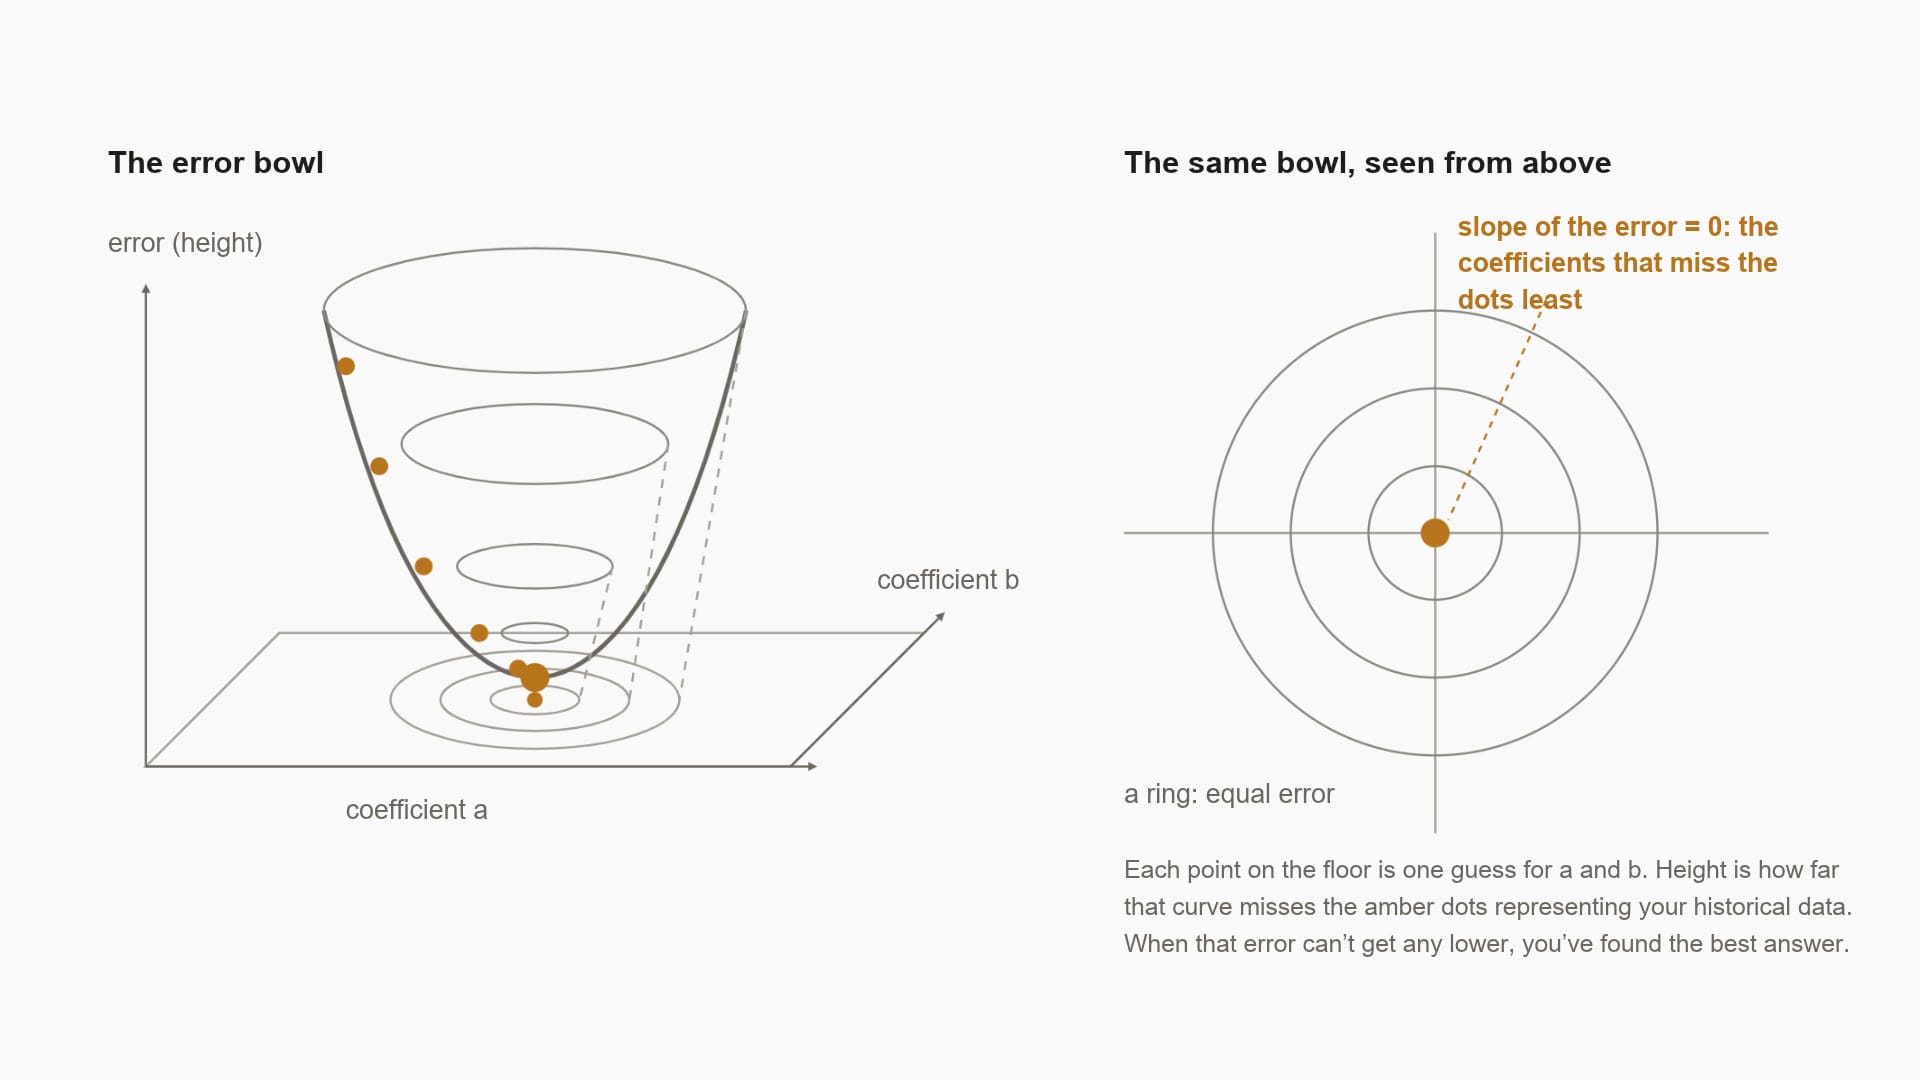
Now load in the platform’s historical data across all advertisers. Here is every impression the platform ever bought, with one label on each: did the platform claim attribution credit or not. Your impressions are in there alongside everyone else's, contributing dots the correct equation’s curve will come close to. Every dot exerts a tiny bit of gravity, pushing the error downhill. Billions of pushes. The weights settle where the pushes can’t get the error any lower. That spot is the answer least wrong for everyone on average. It is the 7.
Consider the weight on a dimension labeled "user has converted before.” Across the whole historical dataset, it is the single most consistent predictor, so the weight on this dimension will be enormously high. It points at people who buy things online.
Some buyers are more active in certain categories, so platforms learned to use category labels as a dimension in their pooled propensity model. This site for an insurance converter, that hour for a snack converter, this audience segment for a car dealer site visitor. They sit inside the same model as everything else. The difference is which converters contributed the dots on the curve. Every insurance converter pulled on the insurance converter weights. Those weights describe what the platform has learned about how insurance converters show up. They are the category’s average shopper, solved by the category’s crowd.
Your conversions have gravity too. A few hundred thousand of them, pushing toward what works for you and your category. However, whenever your push disagrees with the crowd's, the crowd wins. Your signal is outvoted. The more it differs from the crowd, the more it’s outvoted. Where you’re unique, you are the outlier, the tail in the distribution that’s shaved off in the process of descending the overall error as low as it can be, to make the platform mostly right for the bulk of advertisers.
For some customers, that is fine. A startup brand with very little market share needs category shoppers. No one is its customer yet. Most shoppers don’t even know the startup exists. The crowd's answer and the startup’s answer are close together. The pooled model serves not just one startup, but all startups, very well. They all face the same challenge.
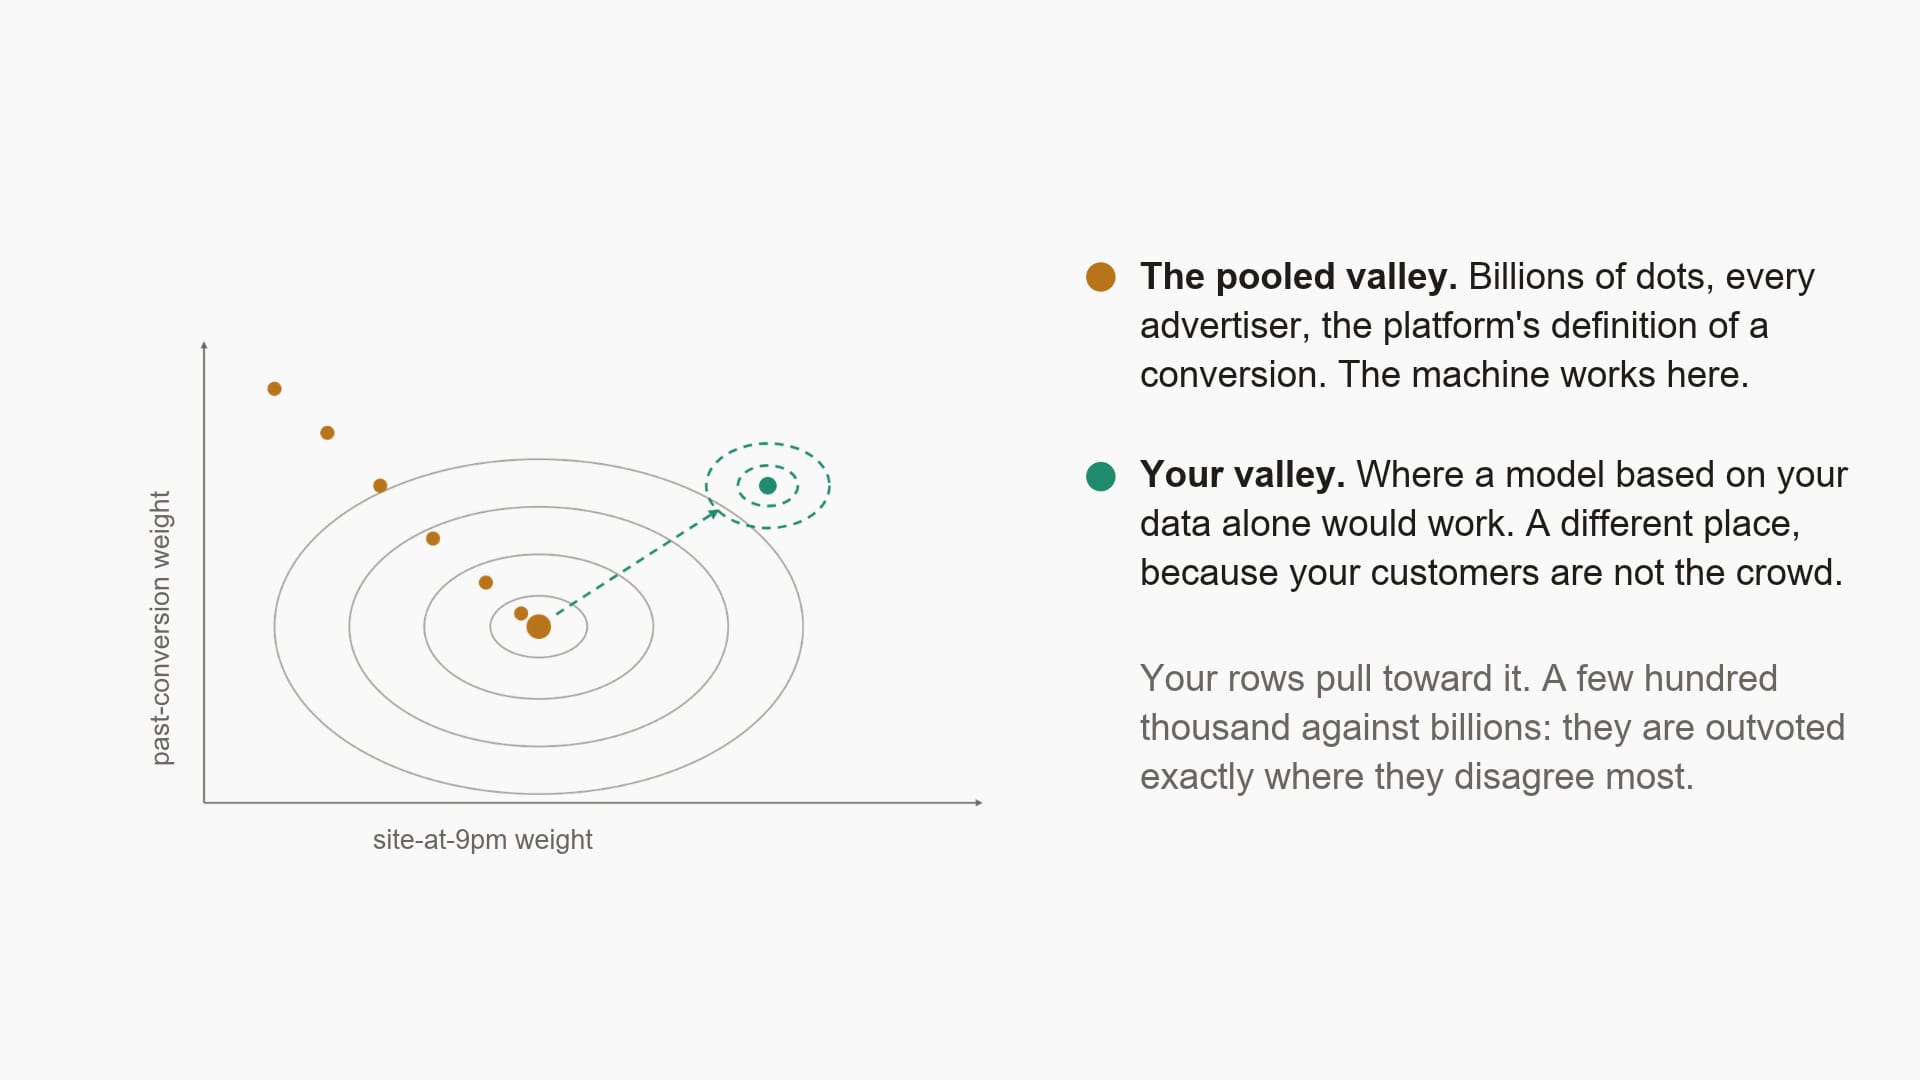
The leading brand is in the opposite position. When startups win category shoppers, they steal them from the leader. A leading brand can only grow via strategy: reaching a segment it under-indexes in, cracking a competitor's base, penetrating a new occasion or testing a new price. Those are the places where its answer differs most from the category's. And the weight that dominates the pooled model, "has converted before," points straight back at the leader's own customers. “Leading” means the largest share of category buyers are yours. The leading brand needs help executing an uncommon strategy, reaching targets no one else is thinking about. The pooled platform aims at the crowd.
What your CRM file actually does
Every platform will tell you that uploading your customer file improves the algorithm. It does, in the sense that your reported numbers get better. Here is what happens inside the function.
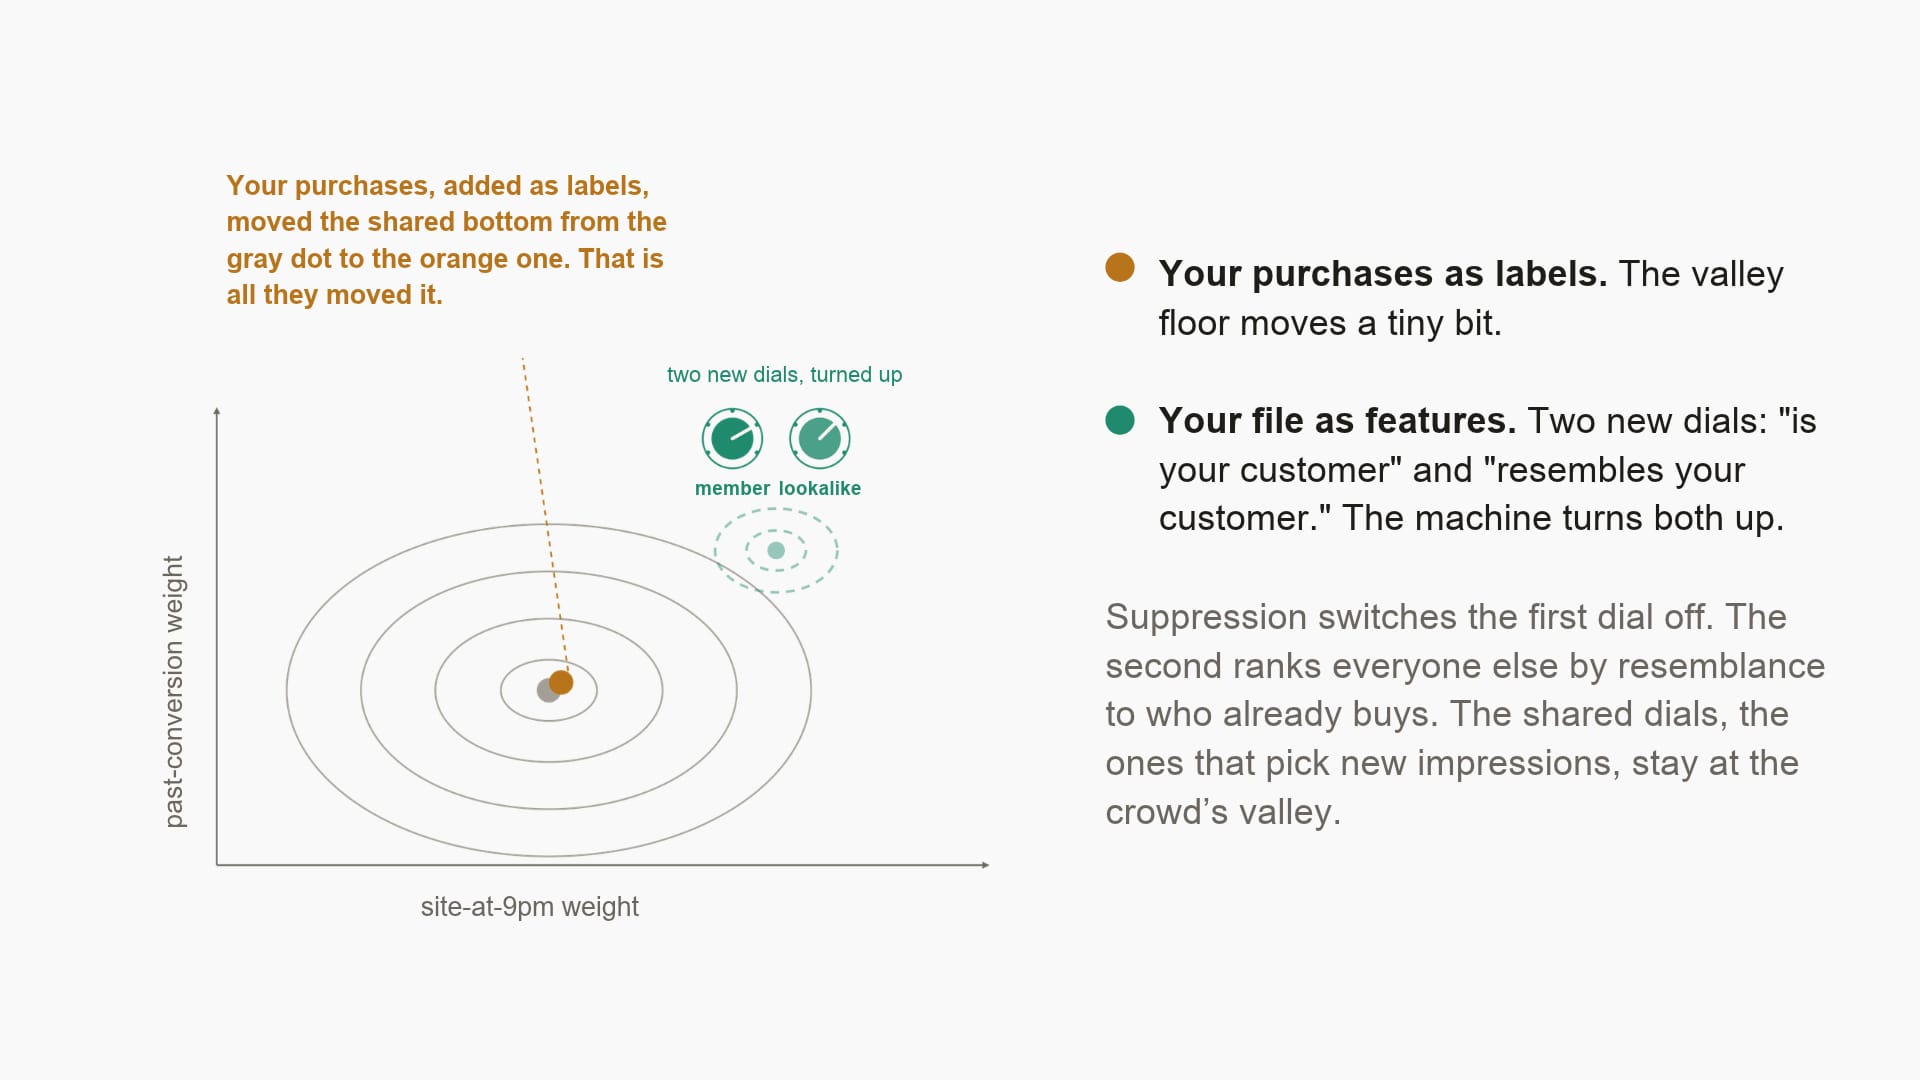
Your uploaded purchases become new historical data. They move the shared valley bottom from the gray dot to the orange one. But they don’t move it much, because you’re adding at most a few hundred thousand rows against billions.
Your file also gives the machine two new dials. The first is membership: this person is already your customer. The machine turns it all the way up, because your existing customers convert at a high rate. The second is resemblance: this person looks like your customers, according to the platform’s data. The machine turns that one up too.
Here is the part nobody mentions. Before the file, the model could only explain your conversions with the shared weights. Say your buyers show up at 9pm on a certain site more than the crowd does. Your rows pushed that weight up a little. Not much, but it was your data teaching the model something about where your customers are.
Now think about what your file looks like to a machine built to give the most popular answer. The crowd picks 7. Your customers, it turns out, pick 2, 3, 4 and 8. You have not helped the model. You have handed it a contradiction. If it took your data seriously it would have to move the shared weights away from 7, and 7 is what it is for. So it does the thing that resolves the contradiction without touching the answer. It quarantines you.
The way platforms do this is to tag your customers, and the users who look like them, as special cases. The tag adjusts your bid without adjusting what the model believes. Your people get a boost. Your lookalikes get a boost. Not one shared weight moves an inch away from the crowd's value. Your data is honored as an exception and ignored as evidence. The model still picks 7 for everyone, including you. Your customers' preference for 2, 3, 4 and 8 goes nowhere. The model never learns it. It will recognize your customers by their tag when they turn up in an auction and pay extra for them. When it goes looking for your next customer, it picks 7.
A more diligent advertiser, after uploading its CRM, will suppress its own customers and set the platform to only find new ones. This is like the chatbot told not to pick 7. Suppression removes the tagged-and-quarantined list. The function is untouched. It takes the next-highest scores, which is now the resemblance dial ranking everyone outside your file by how much they look like the people already inside it. The spike moved to 5. Suppression changes the answer the model is allowed to give. It does not change the answer it has.
In a two-player category, the second answer might not be a bad place to land. Suppress Verizon's base and the lookalike might point in the direction of T-Mobile customers who resemble Verizon customers. That is a real conquest audience. But resemblance is not propensity to switch. The T-Mobile customer who most resembles a Verizon customer may be unmovable. What makes someone switch is a contract ending or a service issue. A platform lookalike is never fit on switching. It was fit on your customer tag. The audience might look like your customers, but it doesn’t even attempt to predict becoming one.
Step back and look at what the platform did with your file. It did not model your customers. It tagged them. The weight assigned to that label is a lookup: in the file or not. It carries nothing about who those people are, not tenure, not what they bought, not whether they are the kind of customer you want more of. The model learns one fact from the tag, that tagged people convert for you. It learns nothing about what triggered the conversion, because the tag explains the conversions entirely. The lookalike recovers a little of their nature, but only as the platform's features, averaged, used to find people who resemble the base. What you actually know about your customers never enters the function.
To weight the properties of one advertiser's customers, the platform would need weights that belong to that advertiser, fit on that advertiser's rows, against that advertiser's goal. That would be a per-advertiser, custom model. It would contradict the premise of a platform: one function, trained on everyone, served to everyone, at a cost spread across all of them. The tag is not a shortcut the platform took instead of modeling your customers. It is the only way to accept your data without breaking the architecture. And there is no half measure, because a half-done per-advertiser weight is just the pooled weight with a small offset. That’s what the tag already is.
The correct weights for category leaders are far from the correct weights for the crowd. They are not the crowd's weights nudged your direction. They are a completely different set of weights for a completely different goal. The platform's model answers what makes anyone convert for anyone, and your file made it a little better at recognizing your customers by ID. The model you need would predict the best impression opportunities given your unique strategy. That question has to be solved from scratch.
One label, or many
The fix is not more data. The platform has more data than you will ever have. The fix is a different question.
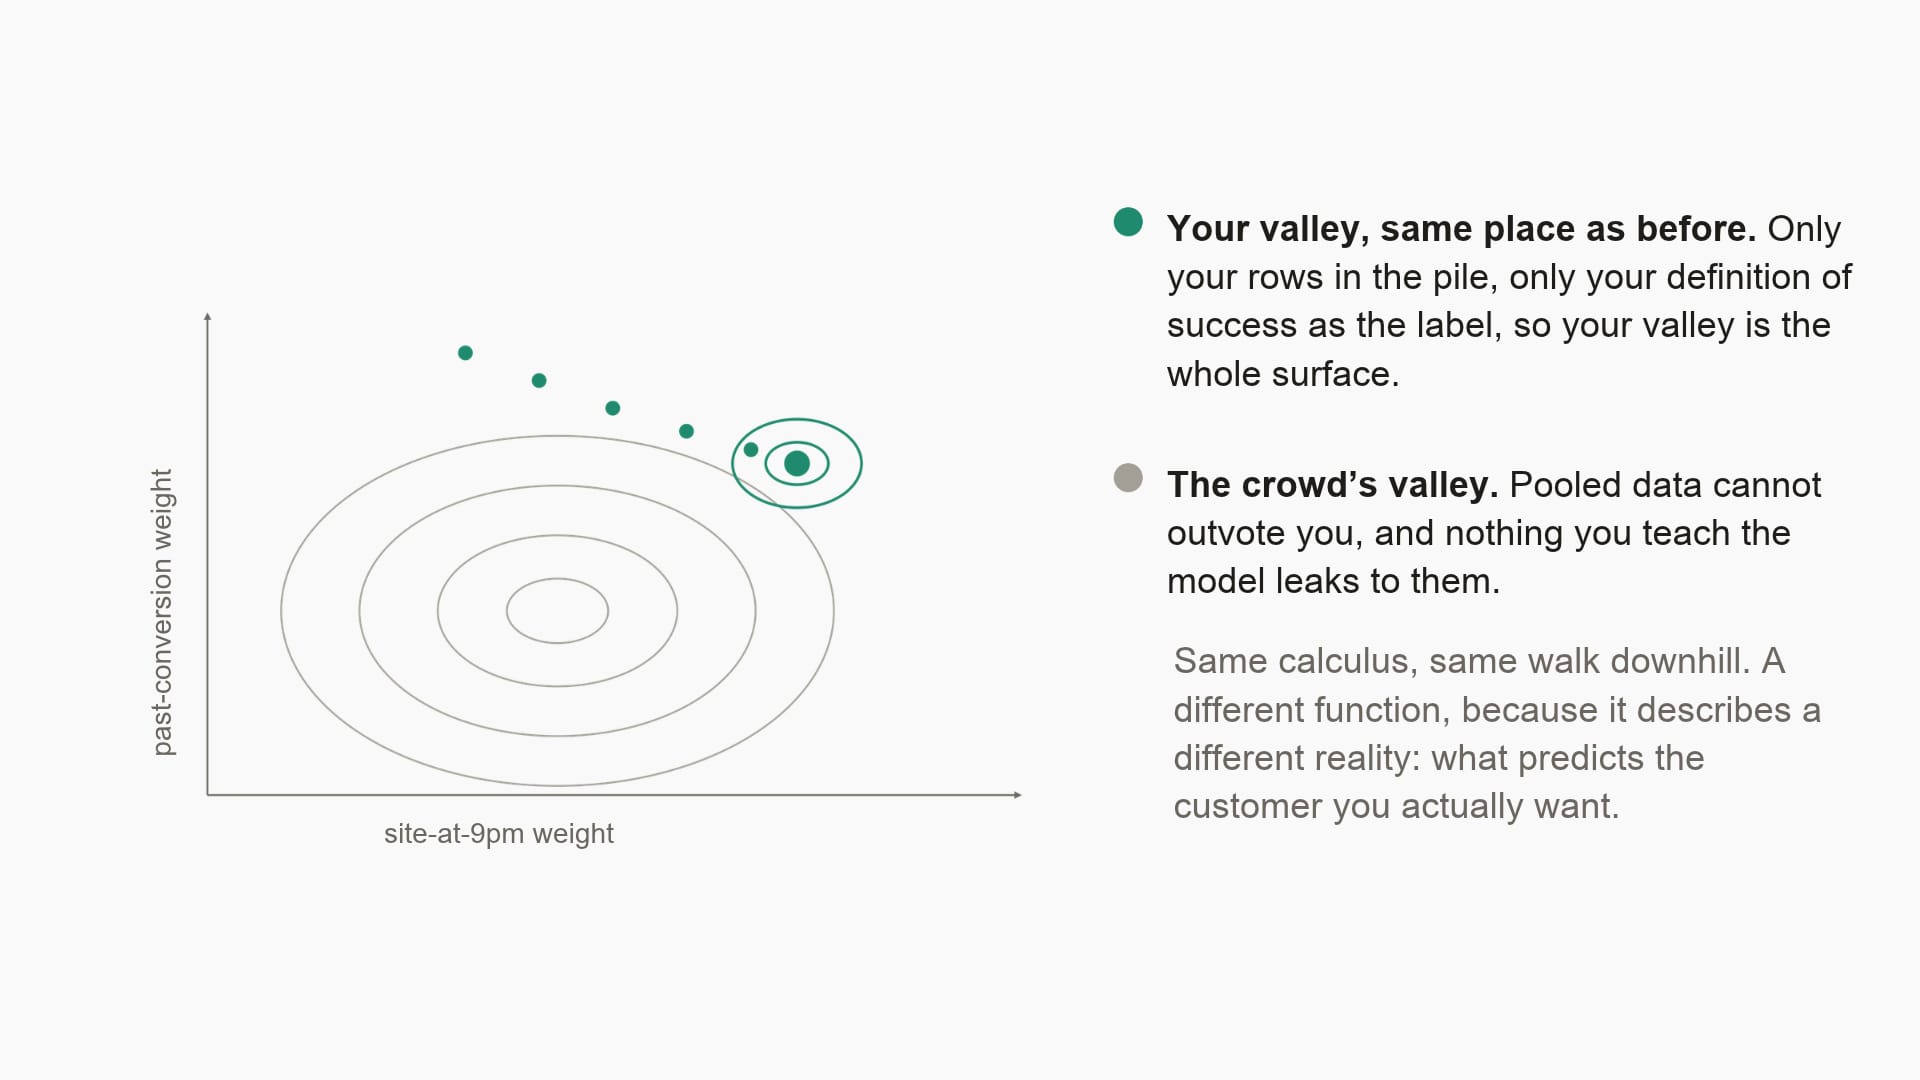
The platform's historical data has one label: did the platform claim credit for a conversion. A loyal customer's ninth purchase and a competitor's customer buying for the first time are both a 1. To the model they are the same event. The thing a leading brand is trying to buy, a valuable new customer, is invisible in the error the platform minimized.
Brands know the difference. You care which of last year's conversions were new customers and which were the loyal base buying again. You care about cross-sells and sales that came in with no media touches. Those are not the same. They are four different things that happened, and only one of them is growth.
You need more than an attributed yes or no. Instead of predicting conversion credit, a custom model can predict growth: the probability that this impression leads to new value for the brand. New customers might be the only class you want your advertising to drive. The loyal base, the cross-sells and the walk-ins, then, are each their own class, and the model must be fit to tell them apart.
This is what a brand's data is actually for. Not a list of IDs to tag. A record of actions you value most, least, and in between. These are distinctions the platform cannot model. But they are what defines growth.
No platform has built this, and better labeling would not fix it. Suppose you handed it a complete set of labels. To use them it would need weights that say what a new customer looks like for you, as opposed to a loyal one for you, and those weights would be wrong for every other advertiser on the platform. One model serving everyone has to minimize everyone's error at once, so only shared labels can contribute. Picking 7 is not a choice the platform makes. It is what optimizing for every advertiser with one model amounts to. Your four labels are 2, 3, 4 and 8. The architecture demands ignoring them.
Your valley is in a different place not because you have less data, but because it was solved for a unique goal. The platform model answers the crowd's question. Your model answers a question you alone are asking.
Growth and the lumpy curve
Go back to the first chart. The human curve is lumpy because people are different and their reasons are their own. Someone thinks 3 is lucky. Someone else likes 9. The spike is all of that erased, because erasing outliers is what that machine is for.
A leading brand that wants to grow is an outlier. To grow at enterprise scale is to embrace the diversity of human responses. It requires a model built to represent one brand’s reality, which is always an edge case, far from common. A model fit on one brand's data against one brand's labels is not a smaller spike. It is distribution restored: this brand's customers and prospects, as varied as they actually are, valued one at a time.
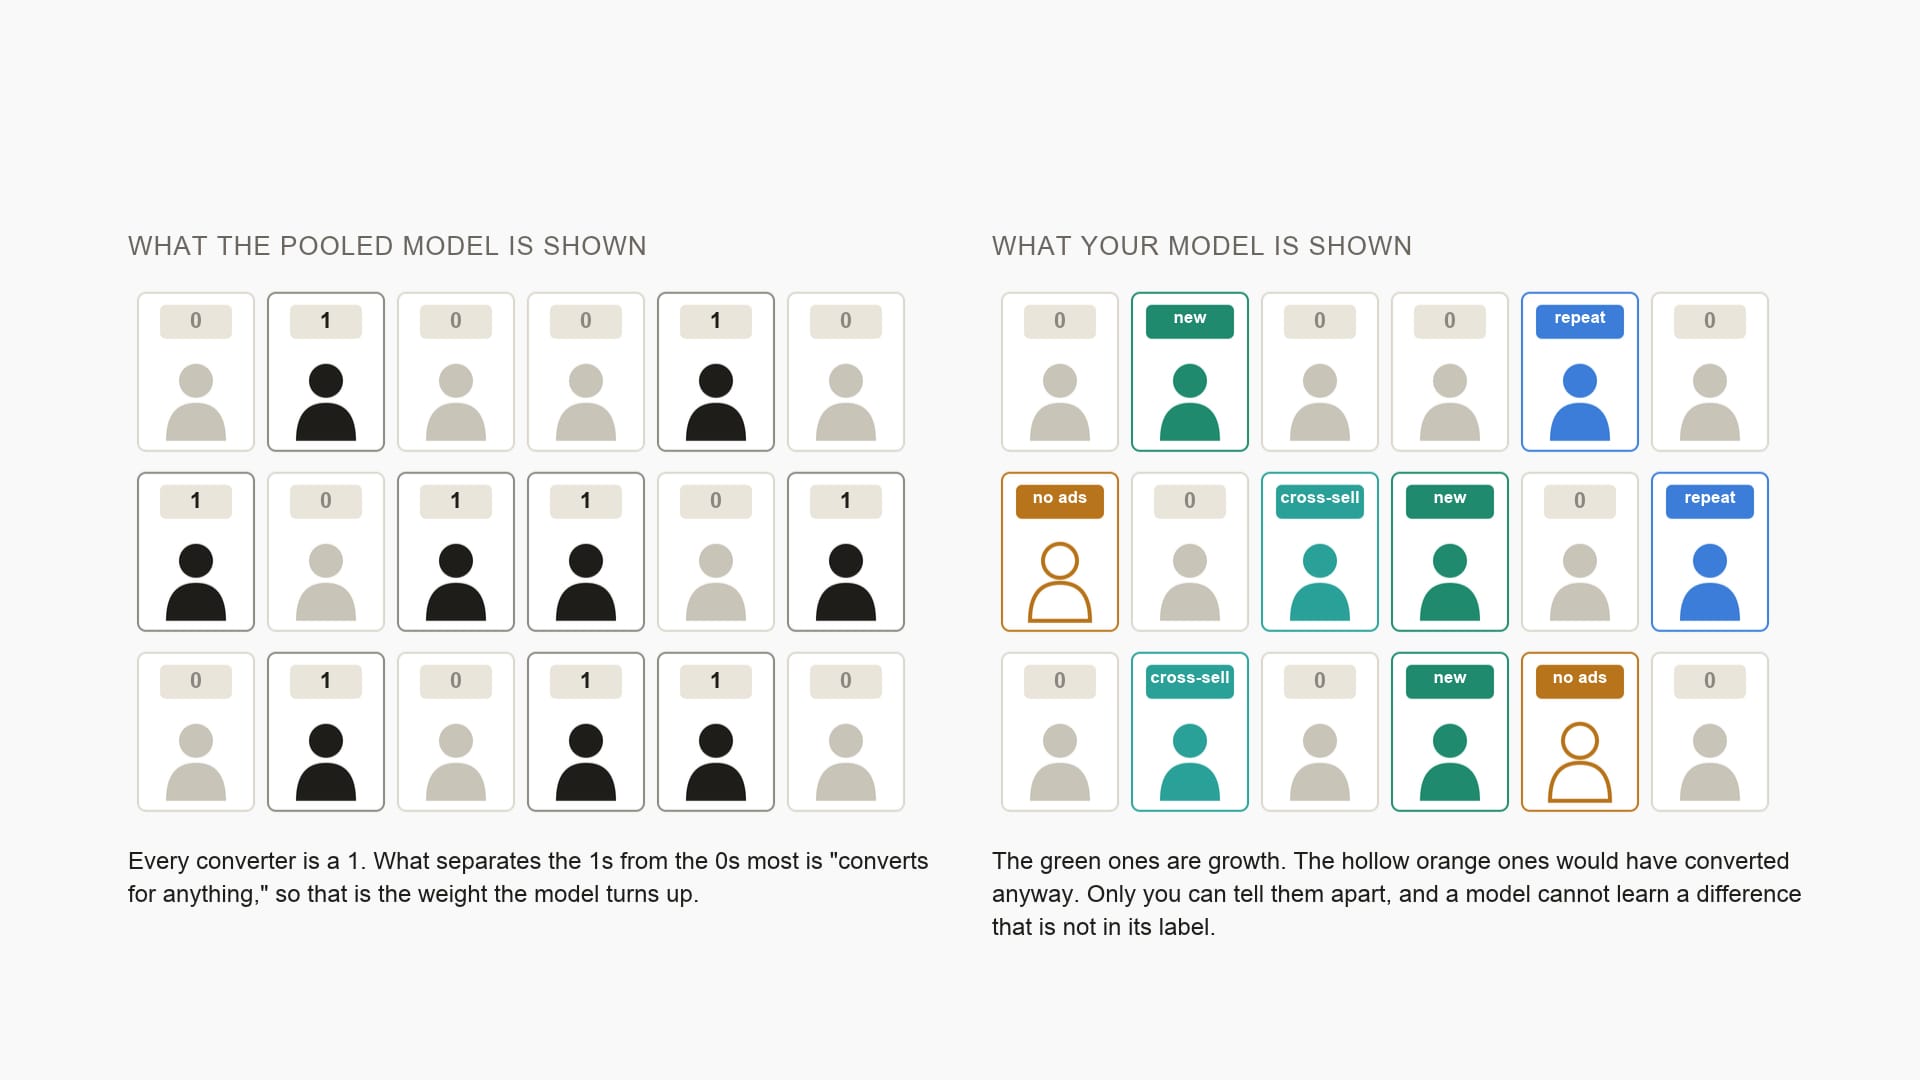
This is what return on data means. A brand's first-party data is not a list of names. It is the record of its own lumpy curve: who became a customer, who was already one, where they came from and why. That record is the only description of the brand's reality that exists anywhere. Hand it to a machine that picks 7 and it gets tagged, boosted and quarantined, and the return on it is just a number on a dashboard. Fit a custom model to it, against the brand's own definition of growth, and every weight in that model is a piece of the record turned into a decision. Then there is payoff.
The greatest payoff will come from ad auctions. You only make money at auction by knowing something the other bidders do not. If every bidder's model says an impression is worth $4, it clears at $4. Every advertiser on a shared platform is running the same function, so their bids agree and the surplus flows to the platform. A model fit on your rows against your label produces a valuation the market does not share. Where it is higher than the crowd's, you win impressions others undervalue. Where it is lower, you let someone else overpay. The spreads are the return on your unique data showing up as money.
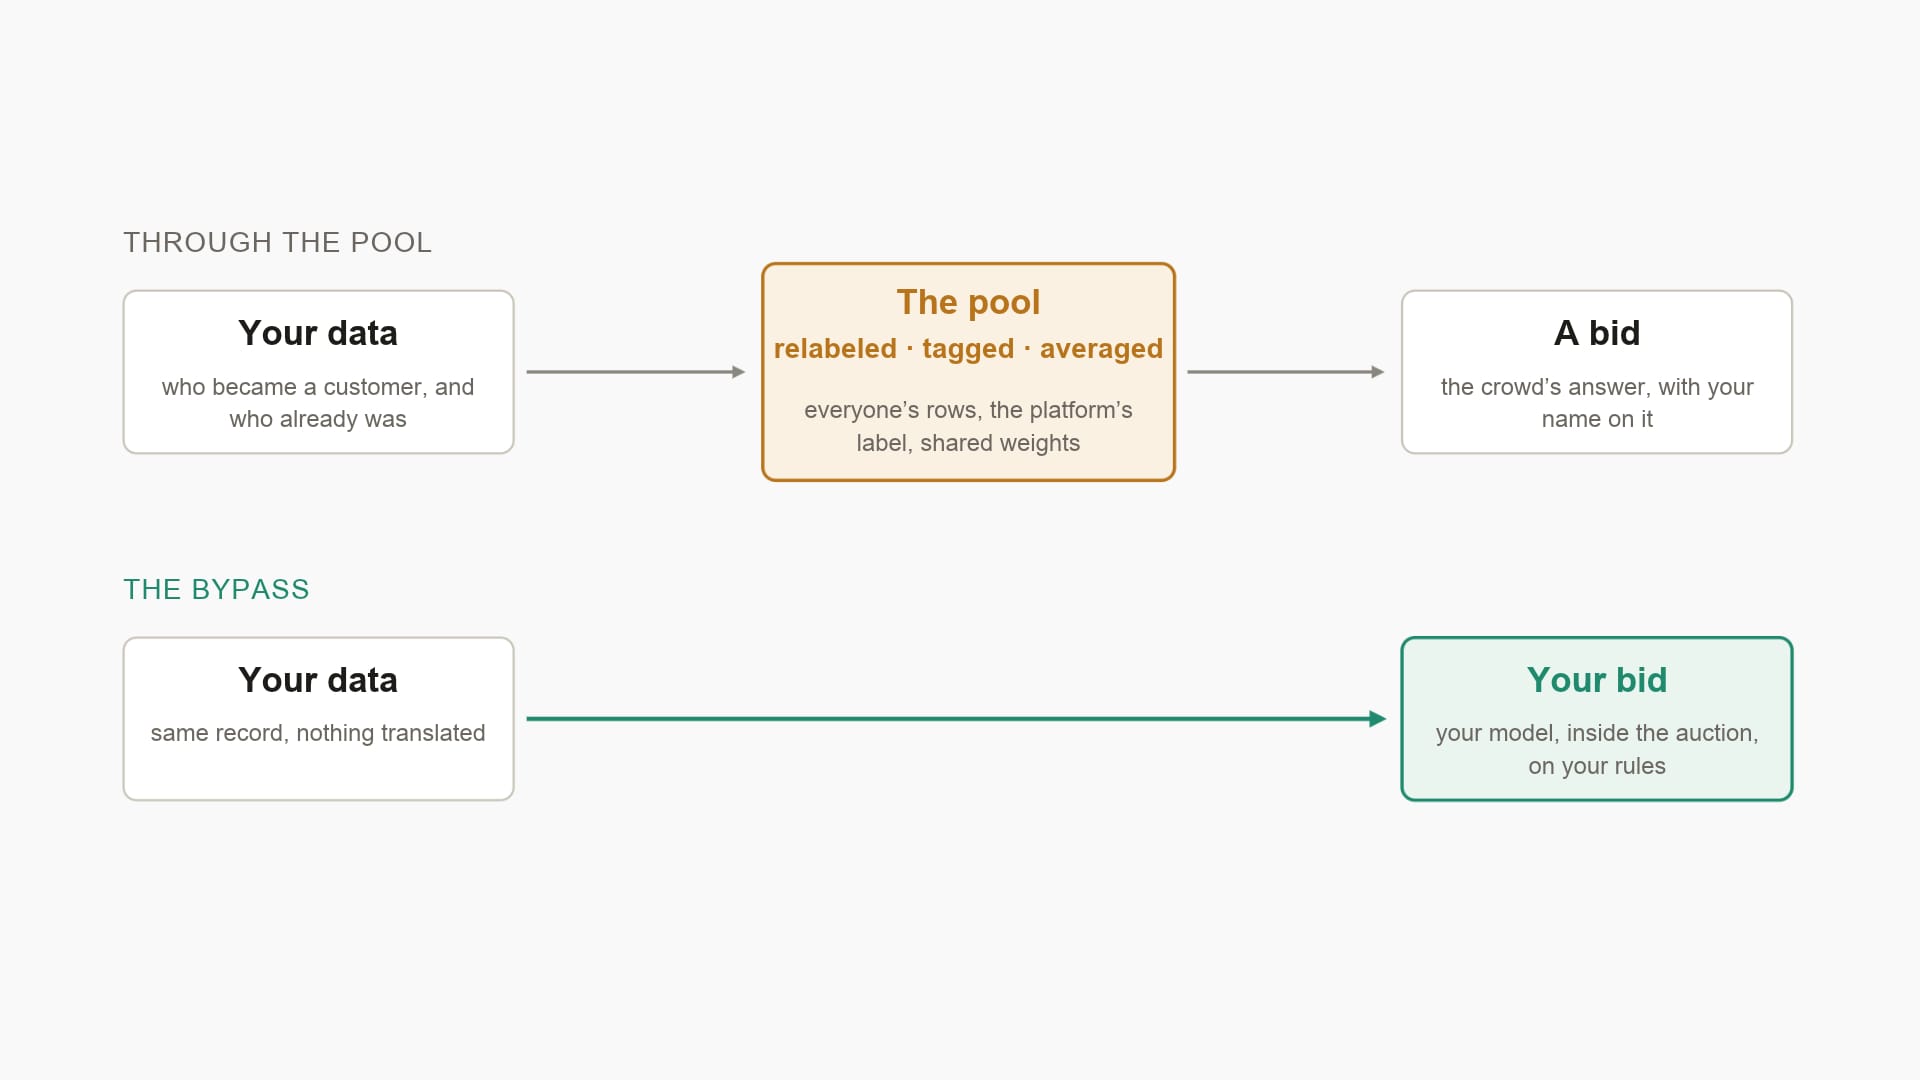
The claim here is not that pooled models are inaccurate. The claim is they converge, and that convergence is wrong for strategy. It’s getting worse with platform AI, not better. The chatbot's spike came from more tuning, not less. The harder a shared system optimizes toward a shared objective, the more uniform its outputs across the advertisers inside it.
Remember the rocket scientist. Her equation could only describe the launches she had. The platform's equation describes the crowd's past, with its unknowns set to whatever fit the crowd. When it predicts your next customer it is extrapolating from a history that is mostly not yours. A model fit on your data against your labels is extrapolating from your unique brand history. It is a model of your business. It’s the only kind that can predict your growth.